How To: Program Your Own Indicators

Overview
NinjaTrader is a rapidly growing trading application that utilizes C# to program your own custom indicators and automated trading strategies. All code examples (or NinjaScript as the platform refers to them) on this website are programmed for the NinjaTrader platform. For a complete description of how to program for NinjaTrader, please see the official website here.

Below is a quick guide on how to get started with the indicator examples posted on this blog. The strategy wizard is very similar and will be detailed later if there is sufficient demand for it.

Part 1

Choose "Tools > New NinjaScript > Indicator..."


Click "Next" to get to the next window.


Do exactly what the wizard tells you: enter your indicator name and a brief description.


For ease of use with code from this blog, delete all the default values on the next few pages. Until you get to the last page...


Click "Generate" instead of finish to take you to the NinjaScript Editor window.


Part 2

You should be left with something like the following code, pay attention to the parts in bold:

// Using declarations

// This namespace holds all indicators and is required. Do not change it.
namespace NinjaTrader.Indicator
{
    ///

    /// My Indicator Name
    ///

    [Description("My Indicator")]
    public class MyIndicator : Indicator
    {
        #region Variables
        // Wizard generated variables
        // Add any global variables from this blog's examples here.
        int SomeGlobalVariable = 0;
        #endregion

        ///

        /// This method is used to configure the indicator and is called once before any bar data

        /// is loaded.
        ///
        protected override void Initialize()
        {
            CalculateOnBarClose    = true;
            Overlay                           = true;        //  Displays your indicator over the price bars or separately.
            PriceTypeSupported    = false;
        }

      // Paste a function from this blog anywhere in this area.
      public void SomeIndicator()
      {
      // Do something.
           SomeGlobalVariable = Close[0];
      }

        ///

        /// Called on each bar update event (incoming tick)
        ///

        protected override void OnBarUpdate()
        {
            // Use this method for calculating your indicator values.
            // Call the function that you pasted above.
            SomeIndicator();
        }

        #region Properties

        #endregion
    }
}

// NinjaScript generated code. Neither change nor remove.
// This namespace holds all indicators and is required. Do not change it.


That's it! Just edit the bold sections above and you should be good to go. Happy programming!

When to Ignore the Technicals

When the Fed chief says he doesn't care about a weak dollar, or the prices of commodities rising so that we can avoid deflation, you better believe the market will move higher on that. Except now EVERYONE is going to jump on the short dollar / long commodities trade. If you want to help inflate the bubble, jump on in, but I would suggest that you use options so you don't get burned when the bubble bursts.

Some of the only good economic news that I've been able to find:


The Baltic Dry Index has doubled in the past month. It's still more than 50% below its all-time high, but still nothing to sneeze at.

I'm not willing to participate in the market's ecstasy at these levels, but I am a little short financials and long-term bearish over the next 6-9 months.

Knowing When to Sell

This market has been overbought for the past three months. Unless you're Apple or Goldman Sachs, your company probably hasn't increased its earnings with increased revenue. Maintaining profitability by laying people off is only hurting this economy more.

Goldman Sachs' projected year end level for the S&P is 1,150. Let's say that 1,100 is close enough. If you're staying in this market for 50 more points, you're being too greedy. It's time to sell. Get out or buy some puts on the Russel 2000 to hedge your bets.

Forex

When searching for Forex information on the internet you are likely to find articles relating to trendlines and trendline analysis. Tom DeMark is a specialist in the field of technical market analysis and his best-selling book The New Science of Technical Analysis is chalk-filled with technical indicators and rationale to explain the market.

Derivatives

Derivatives are a class of securities whose price is derived from one or more underlying assets but may include additional factors such as interest rates, time to expiration and various other economic factors. The derivative itself is a contract between two or more parties to exchange a fixed amount of the underlying security at a given date and price. The most common underlying assets include stocks, bonds, commodities, currencies, interest rates and market indexes. Most derivatives are characterized as risky investments because of their high leverage. 

This page will primarily focus on the two most common forms of derivatives: options and futures. The primary difference between options and futures is that options allow the right to buy or sell the underlying asset at expiration, whereas futures have an obligation to buy or sell the underlying asset at expiration.

Options
Options are a contract between two people for the right to exchange a fixed amount of shares (typically 100 shares per contract) of a given security at a given strike price on a given date. Stock options are issued as puts (downside exposure) or calls (upside exposure) and can be combined to create spreads, which are used for effective risk management.

Common options spreads:
  • Vertical Spread
  • Covered Call
  • Collars
  • Diagonal Spreads
  • Backspreads
  • Iron Condors
  • Straddles and Strangles
  • Butterflies and Condors
  • Calendar Spreads
Futures
Futures are a financial contract obligating the buyer/seller to purchase/sell an asset--such as a physical commodity or a financial instrument--at a predetermined future date and price. A futures contract will include the type and quantity of the underlying asset in a standardized format that is traded on a futures exchange. Some futures contracts require physical delivery of the asset, while others are settled in cash. The futures markets are characterized by the ability to use very high leverage relative to stock markets.

Futures can be used either to hedge or to speculate on the price movement of the underlying asset. For example, an oil producer can use futures to lock in a given price to sell his oil at and reduce risk (hedge). However, individuals and hedge funds are allowed to speculate on the direction of oil by purchasing or selling oil futures.

This page will gradually expand to include ways to dynamically hedge your derivatives positions and explain various ways of pricing options and futures premiums.

Fundamental Analysis

Fundamental Analysis evaluates a security by examining the intrinsic value of the underlying company, country, or financial sector through measuring economic, financial and other qualitative and quantitative factors. Fundamental analysts also study macroeconomic and microeconomic factors that effect the security's value.

The goal of fundamental analysis is to produce a value that can be compared against the security's current price, to determine if the given security is overbought or oversold.

This method of security analysis is considered to be the opposite of technical analysis. For an exhaustive reference of fundamental analysis, consider purchasing a copy of Benjamin Graham's Security Analysis.

Eventually, this page will contain live updates of stock analysis and resources.

Technical Analysis

Technical Analysis is a method of evaluating securities by analyzing statistics generated by market activity, such as past prices and volume. Technical analysts does not attempt to measure a security's intrinsic value, but instead use charts and other tools to identify patterns that can suggest future activity.

The majority of information provided on this site is based on technical analysis and these are several very common studies used to generate that information:
  • MACD
  • Stochastics
  • RSI
  • Bollinger Bands
  • Guppy Multiple Moving Averages

Daily Levels


S&P 500


Note:
The Russell 2000 levels are calculated from the IWM ETF.

Disclaimer:
Quotes may be delayed up to 20 minutes. Information is provided 'as is' and solely for informational purposes, not for trading purposes or advice.

September 2, 2009

Today was a lackluster day. The market is looking forward to the employment numbers coming out on this Friday, so I would expect the market to drift lower until then.

On a side note, Agriculture stocks have been getting some attention recently. Big names like Potash(POT) and TerraNitrogen (TNH) are at decent valuations and might be worth taking a look at.

As the market consolidates, I wouldn't look to do much until Friday comes along.

Disclosure:
At the time of this write, I had no position in any of the stocks mentioned.

Summer Reading

Interested in learning more about options? Try reading one of these books:
  • Jon, Sheldon Natenberg's "Options Volatility and Pricing" 
  • Lawrence McMillan's "Options as a Strategic Investment"
  • Nassim Taleb's "Dynamic Hedging"
  • John Hull's "Options, Futures, and Other Derivatives."
Or these for trading:
  • Taleb's "Fooled by Randomness"
  • Benoit Mandelbrot's "The Misbehavior of Markets"
  • Jack Schwager's "Market Wizard" series
  • Roger Lowenstein's "When Genius Failed."
  • "Liar's Poker," by Michael Lewis
  • John Allen Paulos' "A Mathematician Plays the Stock Market"
The following is taken from a post by Chris McKahnn:

Volatility Smile ChartFinally, there is "My Life as a Quant" by Emanuel Derman. This one may be hard to find, as I got it from the local library, but if you like math, physics, or options theory, this is an excellent read. Fighting Paulos' efficient market discussion, Derman takes on the problem of the "volatility smile" (the differing levels of implied volatility for different strikes within a given month).
"I realized that the existence of the smile was completely at odds with Black-Scholes' 20-year-old foundation of options theory. And if the Black-Scholes formula was wrong, so was the predicted sensitivity of an options price to movements in the underlying index, its so-called 'delta.'"

Derman spends much of the book discussing models, their development, their uses, and their limits. His conclusions clearly have been largely ignored, as evidenced by the market turmoil at the end of last year, which many believe to have been caused by over-reliance on models.

"Models are only models, toy-like descriptions of idealized worlds. But no mathematical model can capture the intricacies of human psychology. ... I saw that if you listen to the model's siren song for too long, you may end up on the rocks or in the whirlpool."

August 28, 2009

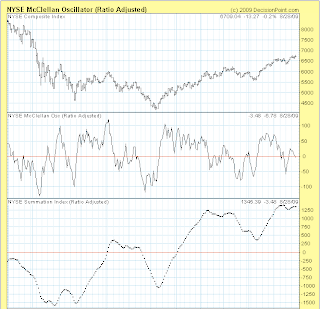
Yet another slow day. China was down almost 3% last night and I would have expected that to have more influence in today's market action, but no dice. Lower consumer sentiment dragged the market for most of the day. Intel raised their guidance, which helped buoy tech today, but this market already has a lot of good news baked into it, and I think what we're seeing is things beginning to stall.

The McClellan oscillator is showing that the market is poised for a pullback:
McClellan Index 

Disclosure:
At the time of this writing, I had no positions in any of the stocks mentioned.

August 25, 2009

Consumer confidence helped boost the market up today. However, the Baltic Dry Index is still clearly in a down trend as seen in this chart:
Baltic Dry Index ChartThis should signal that commodities prices are headed lower, and with lower oil, you expect the the large cap oil services stocks to start dragging down the rest of the market.

I am a little concerned that anytime we get any sizeable pullback, all these fund managers that missed the rally are stepping-in and buying the dips. I think they're setting us up for a nastier pullback this fall than we otherwise would have had.

Putting a 20 multiple on earnings, I'd say fair value for the S&P is around 880. When people finally realize that, this market is going to get ugly fast. But for now, it looks like we're going to continue to drift higher.

Disclosure:
At the time of this writing, I had no position in any of the stocks mentioned.

Risk Disclosure

Forex
Forex is a leveraged product and carries a high degree of risk to your capital and it is possible to lose your entire investment. Only speculate with money you can afford to lose. This product may not be suitable for all investors, therefore ensure you fully understand the risks involved, and seek independent advice if necessary.


Options
Options involve risk and are not suitable for all investors. Prior to buying or selling an option, a person must receive a copy of Characteristics and Risks of Standardized Options (ODD). Copies of the ODD are available from your broker, by calling 1-888-OPTIONS, or from The Options Clearing Corporation, One North Wacker Drive, Suite 500, Chicago, Illinois 60606. The information on this website is provided solely for general education and information purposes and therefore should not be considered complete, precise, or current. Many of the matters discussed are subject to detailed rules, regulations, and statutory provisions which should be referred to for additional detail and are subject to changes that may not be reflected in the website information. No statement within the website should be construed as a recommendation to buy or sell a security or to provide investment advice. The inclusion of non-CBOE advertisements on the website should not be construed as an endorsement or an indication of the value of any product, service, or website.

Futures
Transactions in futures carry a high degree of risk. The amount of initial margin is small relative to the value of the futures contract, meaning that transactions are heavily "leveraged" or "geared." A relatively small market movement will have a proportionately larger impact on the funds you have deposited or will have to deposit: this may work against you as well as for you. You may sustain a total loss of initial margin funds and any additional funds deposited with the firm to maintain your position. If the market moves against your position or margin levels are increased, you may be called upon to pay substantial additional funds on short notice to maintain your position. If you fail to comply with a request for additional funds within the time prescribed, your position may be liquidated at a loss and you will be liable for any resulting deficit.

Legal Disclaimer

The content of this website is published in the United States of America and persons who access it agree to do so in accordance with applicable U.S. law.

All opinions expressed on this website are solely Short-Term Capital Management’s (STCM) opinions. You should not treat any opinion expressed by STCM as a specific inducement to make a particular investment or follow a particular strategy, but only as an expression of his opinion. STCM’s opinions are based upon information he considers reliable, but does not warrant its completeness or accuracy, and it should not be relied upon as such. STCM is not under any obligation to update or correct any information provided on this website. STCM’s statements and opinions are subject to change without notice.

Past performance is not indicative of future results. STCM does not guarantee any specific outcome or profit. You should be aware of the real risk of loss in following any strategy or investment discussed on this website. Strategies or investments discussed may fluctuate in price or value. Investors may get back less than invested. Investments or strategies mentioned on this website may not be suitable for you. This material does not take into account your particular investment objectives, financial situation or needs and is not intended as recommendations appropriate for you. You must make an independent decision regarding investments or strategies mentioned on this website. Before acting on information on this website, you should consider whether it is suitable for your particular circumstances and strongly consider seeking advice from your own financial or investment adviser.

The author uses NinjaTrader as his primary trading platform and will post charts taken from a variety of sources, including but not limited to Google Finance, CNBC, and Bloomberg. Disclosure: I currently do not possess any financial certifications. All code on this website is published under the GPL license as published by the GNU project. The following permission statement should be considered attached to all code posted on this site:

This program is free software: you can redistribute it and/or modify
it under the terms of the GNU General Public License as published by
the Free Software Foundation, either version 3 of the License, or
any later version.

This program is distributed in the hope that it will be useful,
but WITHOUT ANY WARRANTY; without even the implied warranty of
MERCHANTABILITY or FITNESS FOR A PARTICULAR PURPOSE. See the
GNU General Public License for more details.

You should have received a copy of the GNU General Public License
along with this program. If not, see <http://www.gnu.org/licenses/gpl-3.0-standalone.html>

This disclaimer may be modified at any time without your consent and is retroactive. Use any information provided at your own risk.